

Scores and Ranks
How is a country scored from 0 to 100, and what does 50 mean?
Each pillar in the report produces a single score on a 0-to-100 scale. The scale is normalized so that 50 represents the global mean — the average across the 33-country benchmarking universe covered by the report. A score above 50 indicates a position stronger than that average, while a score below 50 indicates a weaker one; the ends of the scale mark the most and least competitive positions in the set. Roughly one standard deviation above or below the mean corresponds to scores near 60 and 40. The scale uses a fixed slope of 10 points per standard deviation in the normal case; when an extreme outlier would push a score outside 0–100, the slope is automatically reduced so that the worst-placed country lands exactly at the boundary. The scale is anchored by the distribution of the 33-country universe on the same twelve-month average that feeds each country's score — so the benchmarking population and the scoring input are always aligned. The exact normalization constants are proprietary; what is disclosed is the anchor at 50, the direction, and these approximate bands.
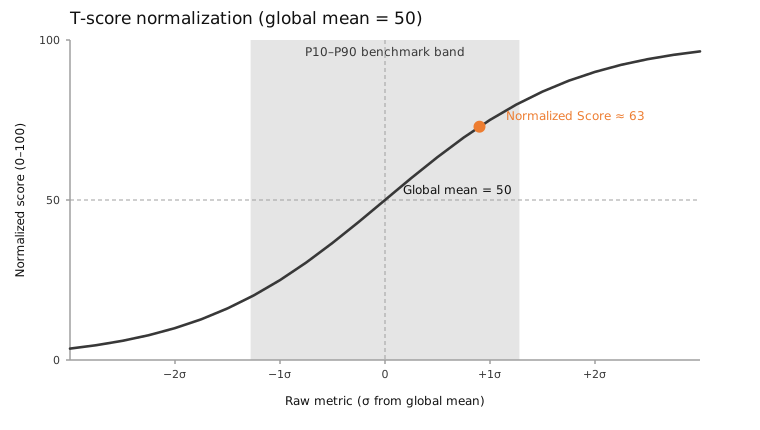
How does a lower cost produce a higher score?
A higher score always signals stronger competitiveness, regardless of what a pillar measures — the same direction holds across all 14 pillars, from Manufacturing Labor Costs to Domestic Market Size. For cost-based pillars, such as Energy & Utilities Costs or Manufacturing Labor Costs, the scoring inverts the underlying value, so a lower cost yields a higher score rather than a lower one. This keeps the meaning consistent across the whole framework: whether the underlying metric is a cost to minimize or a capability to maximize, "better for a manufacturer" always points upward on the 0–100 scale, so scores stay directly comparable pillar to pillar.
How are countries ranked, and what are the tier bands?
Countries are ranked from 1 to 33, where rank 1 is the most competitive and rank 33 the least. The ranking is divided into five tier bands — Top, Upper, Mid, Lower, and Bottom — running from the most competitive countries down to the least. These bands give a quick read of where a country sits relative to the full set: among the leaders, the upper-middle, the middle, the lower-middle, or the laggards.
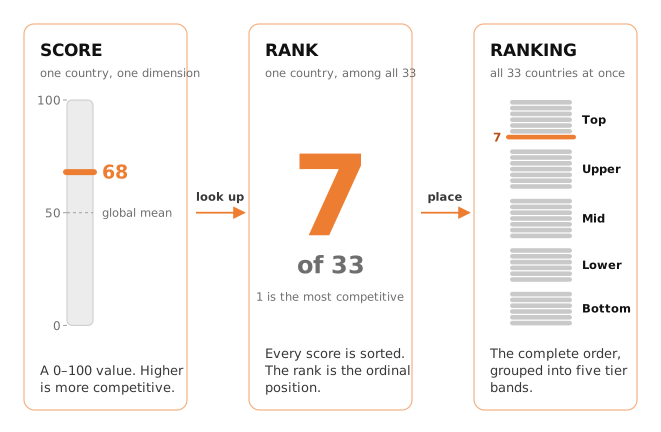
Are the other countries in the ranking identified?
No. A report discloses the assessed country's own score and its exact rank among the 33 covered — but the remaining 32 countries are never identified by name, and their individual values are not published. Position is expressed against the distribution instead: the global average at score 50, the percentile bands (P10, P50, P90), and the tier band the rank falls in. This anonymized form of benchmarking keeps each subscriber's assessment confidential across the subscriber base while still fixing a country's position in the full set precisely.
How does an industry ranking differ from the overall ranking?
An industry ranking measures a country's competitiveness for one commodity family — a related group of products such as Polymers — by combining the eight Base Pillars (shared structural factors common to all manufacturing) with the six Industry-Specific pillars evaluated for that family. The report publishes seven industry rankings, one per commodity family. The overall ranking is the aggregated picture across all industries, consolidating the Base and Industry-Specific layers into a single competitiveness view. In short, an industry ranking is family-specific, while the overall ranking summarizes performance across families.
Why does a country's ranking vary across industries?
The Base Pillars are shared across every industry, but the Industry-Specific pillars — commodity prices, margins, production, trade, tariffs, and market size — vary by commodity family. A country with abundant, low-cost feedstock for one chemical may rank near the top of that industry, yet sit much lower in another family where its domestic demand is small or its trade position weak. These differences in family-level conditions, not the shared structural base, drive the divergence.
How is the overall competitiveness view assembled?
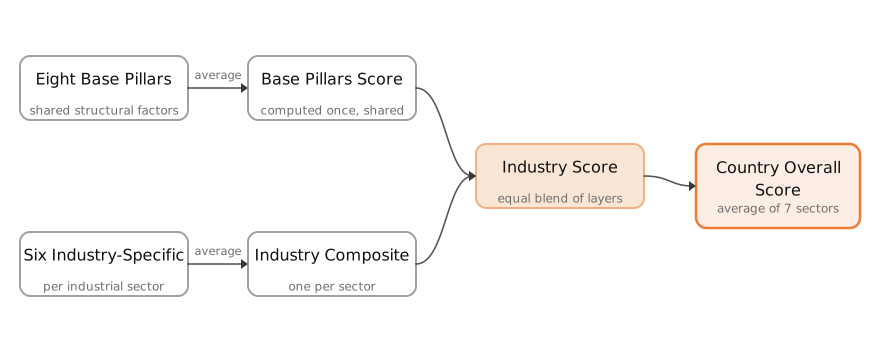
Pillar scores roll up in four equal-weight averaging stages, all on the same 0-to-100, mean-50 scale. First, the eight Base Pillars average — each contributing equally — into a single Base Pillars Score, computed once and shared across all industries because those factors are structural. Second, for each commodity family the six Industry-Specific pillars average, equally, into an Industry Composite for that family. Third, the shared Base Pillars Score and that family's Industry Composite combine in equal measure into the family's industry score, so structural and industry-specific competitiveness count the same. Fourth, the seven industry scores average, equally, into the overall competitiveness view. No score is re-scaled along the way. The combination logic from the pillar level upward is therefore stated openly — equal averaging at every step — while the weighting applied to the metrics inside each pillar stays proprietary. All positions — industry and overall alike — are ranks within the fixed set of 33 countries the report covers.
How is productivity factored into labor scores?
Labor scores are productivity-adjusted: labor cost is weighed against output per worker rather than taken in isolation. A higher-wage country that is also more productive is therefore not unfairly penalized. The productivity factor is expressed as a ratio anchored at 1.0× for the most productive case and rising for less productive ones — up to about 3× for manufacturing labor and about 5× for construction labor, where output per worker is lowest. The anchor points — the most productive and least productive positions on the scale — are calibrated against a broader set of economies than the 33 that receive scores, providing a more stable statistical foundation for the scale.
What does a score not represent?
A score is relative — it describes a country's position within the 33-country set, not an absolute investment threshold, and it is neither a recommendation nor a forecast of profitability. Scores can shift as the underlying data or the peer set's data is updated. The benchmark anchors P10 (10th percentile) and P90 (90th percentile) likewise describe position within the distribution, not a fixed judgment of good versus bad.