

Industrial Utility Costs
What does the Industrial Utility Costs dataset cover?
Summary
Most utility costs are modeled — estimated from three country-level drivers (labor cost, construction-cost inflation, and energy cost) applied to a representative facility of defined size and specification, with the models calibrated against real contract prices, industrial tariffs, and producer price indices. Where a reliable published series exists — notably for process water — the cost is taken directly from gathered tariff data instead, all on a common basis comparable across the 33 countries.
The Industrial Utility Costs reference dataset provides estimated costs of common industrial utilities for each of the 33 countries tracked in the Industry Economics & Competitiveness report. Most figures come from cost models: each model applies established cost-estimating techniques to three country-level drivers — labor cost, construction-cost inflation, and energy cost — to adapt a utility's production cost to local conditions, with the relative weight of each driver varying by utility type. The models are not run in isolation — they are calibrated against real contract prices, industrial tariffs, and producer price indices (PPIs) collected from regional sources. And where a reliable published series is available, the cost is taken directly from it rather than modeled: process water, in particular, is sourced from gathered tariff data when such series exist. Because every country is run through the same model structure and the same input set, the resulting figures stay comparable across locations.
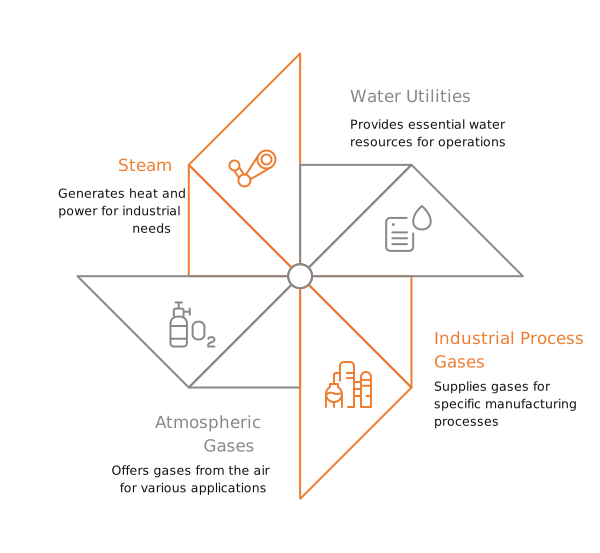
Those three inputs adapt each model to a country, but what a model meters differs by how the utility is produced. The ten priced utilities fall into four families by that production route — steam; water utilities, covering process, demineralized, cooling, and chilled water; atmospheric gases, covering compressed air, oxygen, and nitrogen; and industrial process gases, covering hydrogen and carbon monoxide. The main cost components captured for each utility are:
For each utility, the model assumes a representative facility size (larger facilities carry lower unit cost), with defined purity and pressure specifications for gases and steam. This standardized basis is what allows the cost figures to serve as location benchmarks rather than site-specific estimates. The dataset also includes a price forecast extending about six months ahead, labeled Forecast (F), supporting forward-looking operating-cost projections.
Which ten utilities are priced, and at what assumed capacity?
Summary
Ten industrial utilities are priced, each modeled at a fixed assumed capacity so figures reflect a comparable scale of supply in every country. Larger systems carry a lower unit cost, so a common reference capacity is set for each utility — and for the three steam pressure grades.
The dataset prices ten utilities frequently consumed in chemical and petrochemical manufacturing: compressed air, process water, demineralized water, cooling water, chilled water, steam, oxygen, nitrogen, hydrogen, and carbon monoxide.
Because the unit cost of a utility falls as the producing system grows, every figure is tied to a fixed assumed capacity. A common reference capacity is defined for each utility on two bases — an on-site system sized for a single industrial consumer, and a larger off-site system sized to supply several nearby plants — so figures are comparable across all 33 countries. The table below states those assumed capacities and the key specifications.
Steam is priced at three pressure grades — high (HP), medium (MP), and low (LP) — which together count as one of the ten utilities. The Steam (46 bar) series carries the high-pressure grade's on-site cash cost for one covered country.
The capacities above describe the standardized modeling basis common to every country — the generic overview, not a site-specific estimate. The detailed assumptions behind each individual country assessment (production route, source selection, and country-specific inputs) are documented separately, in a Specific Assessment Guide published for each covered country.
What do on-site, off-site, and contract figures mean?
Summary
Three cost bases capture the full supply-cost spectrum: on-site and off-site cash costs reflect recurring production costs (excluding depreciation, overhead, and return on capital), while the contract price adds those capital-recovery items and represents what a customer pays an external supplier.
Each utility carries up to three figures, each representing a different cost basis:
Cash-cost bases therefore exclude capital-recovery items (depreciation, overhead, return on capital); the contract price includes them. This distinction is useful when comparing self-supply against purchasing: on-site and off-site cash costs benchmark the operating-cost floor, while the contract price benchmarks what the market charges.
Not every utility is reported on all three bases — the applicable basis reflects how that utility is typically supplied in an industrial context. The gases (hydrogen, oxygen, nitrogen, carbon monoxide, and compressed air) and steam are reported on the on-site cash cost basis. Process water is reported as a contract price.
How do utility costs feed the energy and utilities pillar?
Energy cost inputs to the utility models flow from two Intratec data sources — Primary Commodity Prices and Energy Price References — a deliberate cross-solution link that keeps utility estimates consistent with broader energy benchmarks. The resulting utility costs then feed the Energy & Utilities Costs Base Pillar score, where they help quantify how competitively a country can supply the energy and utility services that industrial production depends on.