Price Assessments
Compiled Prices
What are compiled prices?
Compiled prices are assessments calculated from publicly available price data. Raw data consist of price series—value per quantity—published over a month. These raw data undergo a formatting step that adapts them to the Intratec system. After insertion, statistical validation detects anomalies and possible outliers and removes them. The resulting price series are then typically calculated as a monthly average of closing prices for daily or weekly published price data. Once generated, they are directed to the normalization step alongside all other price assessments.
How are compiled prices calculated?
The calculation follows a consistent pipeline:
- Source data: Raw price series from public sources, collected over the reporting month in daily or weekly intervals.
- Formatting: Raw data are transformed to match Intratec's data structure and units.
- Validation: Statistical analysis identifies and removes anomalies and outliers from the formatted data.
- Averaging: Closing prices are averaged across the month to produce a single monthly figure.
- Normalization: The monthly average is passed to the normalization step, the standard final stage for all price assessments.

Because normalization is shared across every approach, a compiled price arrives in the same form as a trade-based or formula-based assessment, directly comparable within its series.
Trade-Based Prices
What are trade-based prices?
Trade-based prices are assessments derived from international trade information reported by countries. Because each reporting country records what it traded, at what volume, and at what declared value, this data can serve as a direct source of commodity price signals — provided the underlying records are sufficiently homogeneous to represent a single market assessment.
Two price types are produced from this data:
- Unit value — the total traded amount divided by total quantity for a given country and month, taken directly from customs authority reports with no statistical treatment.
- Transaction price — a filtered version that removes low-volume records and applies an outlier-detection algorithm to improve accuracy.
How is data homogeneity handled?
Data homogeneity is the criterion used to determine whether a set of trade records all refer to the same assessment — the same commodity, similar specifications, and comparable trade conditions. A completely homogeneous dataset would show no variation; in practice, some variance within a single commodity specification is expected and acceptable.
To establish homogeneity, Intratec applies a clustering algorithm that groups similar trade transactions based on identified statistical modes and data dispersion. Clustering serves two purposes: it discerns underlying market patterns and reduces the impact of anomalies; and it produces a unique price assessment per cluster, avoiding the "basket" effect that arises when heterogeneous trades are averaged together without separation.
If no homogeneity is found in a raw dataset, the data are unqualified for price assessment calculation and are not used.
How is a unit value calculated?
A unit value is calculated as the total amount of money divided by the total quantity of a commodity traded by a specific country in each month, as reported by that country's customs authorities. No statistical treatment is applied — the calculation is a direct ratio from the reported figures.
How is a transaction price calculated?
A transaction price applies two sequential filters to improve data quality before arriving at a price assessment.
Volume minimum filter. Because trade data are usually not provided at the individual-transaction level, minimum volume thresholds are set as a multiples of a typical trade size:
- For internationally traded commodities, the minimum is often two or three times the standard cargo size, which varies by region and commodity.
- For domestic or small-quantity trades, the minimum is a multiple of the most common transportation unit for the region and commodity.
Records below the applicable minimum are excluded before any further processing.
Gross outlier removal. Trade prices that significantly deviate from the median of all transactions are excluded using the Median Absolute Deviation — a dispersion measure more resilient to outliers than the standard deviation. The outlier-detection algorithm employs methods used by the OECD and is applied through a simplified model to remove inaccurate data.
The result is a price assessment grounded in the bulk of representative transactions, with anomalous or atypical records filtered out at both the volume and price levels.
What are the limitations of unit values?
A unit value is the simplest trade-based figure — a direct ratio of reported value to quantity, with no statistical treatment. That simplicity is also its weakness: against the transaction prices and compiled prices published alongside them, a raw unit value carries three limitations for energy-market price analysis.
- Aggregation bias. Customs records group heterogeneous products under broad classifications. A unit value blends those distinct commodities into a single average, so the figure can drift away from the price of any specific grade actually traded.
- No outlier removal. Because no statistical treatment is applied, a unit value does not exclude implausible or erroneous transactions. Transaction prices, by contrast, filter low-volume records and apply outlier detection to keep abnormal values from distorting the assessment.
- Lack of market specificity. A unit value averages across market destinations, price types, and specifications at once. Compiled prices instead differentiate market destination — wholesale, retail, industrial — price type — spot versus long-term contract — and commodity specification, segmentation a unit value cannot reproduce.
For these reasons a unit value serves as a transparent, unadjusted reference, while transaction prices and compiled prices give the more robust basis for tracking a specific energy market.
Formula-Based Prices
What are formula-based prices?
Formula-based prices are assessments calculated as a function of the prices of related commodities, economic indicators, currency rates, and similar variables. They are used when direct market data is unavailable or sparse. The methodology identifies which commodities and factors drive the assessment, establishes a mathematical relationship through regression analysis, and then applies current market data to generate the forecast price.
Intratec explicitly identifies which assessments in each product are formula-based.
How is a formula-based price model built?
The process follows three steps:
- Identify relationships. Market research determines which commodities and economic factors are most likely to correlate with the assessment (typically raw materials or primary derivatives).
- Fit the regression model. A regression model is calibrated by finding parameters that align the model's predictions with historical assessment data.
- Calculate the assessment. The fitted model is applied to current market prices and indicator values to generate the forecast price.
The result maintains the currency and quantity units of the assessment being produced, making it directly comparable with other prices in the same series.
Manufacturing Cost-Based Prices
What are manufacturing cost-based prices?
Manufacturing cost-based prices estimate the operating cost of producing a commodity based on process inputs. These prices reflect the cash outlay required to run a plant, including raw materials (net of by-product credits), utilities, labor, maintenance, operating charges, plant overhead, local taxes, and insurance.
Price = function of KPIs, price of raw materials, utilities, labor, and an industrial-cost index.

Which cost components are included?
Manufacturing cost-based prices incorporate all significant operating expenses:
- Raw materials and by-product credits — The cost of feedstocks and other inputs, net of revenue from saleable by-products or waste streams recovered during the process.
- Utilities — Electricity, steam, fuel, water, and other energy sources required for production.
- Labor — Direct and indirect operating staff.
- Maintenance — Upkeep, repairs, and replacement of process equipment and infrastructure.
- Operating charges — Catalysts, consumables, and other process-dependent costs.
- Plant overhead — Facilities management, administration, and shared services allocated to production.
- Local taxes and insurance — Statutory and operational taxes, plus coverage for equipment and liability.
Where do the input prices come from?
Raw material and by-product prices are sourced from Intratec Primary Commodity Prices (https://intrat.ec/icp). Utility prices come from Intratec Industry Economics Worldwide (https://intrat.ec/iie).
Freight-Based Prices
What are freight-based prices?
Freight-based prices are assessments calculated from another assessment by adding or subtracting the cost of moving the commodity between two delivery points. They let a price established at one location stand in for the same commodity priced at a different point in the supply chain, when direct trade data for that second point is thin or absent.
Two types are produced:
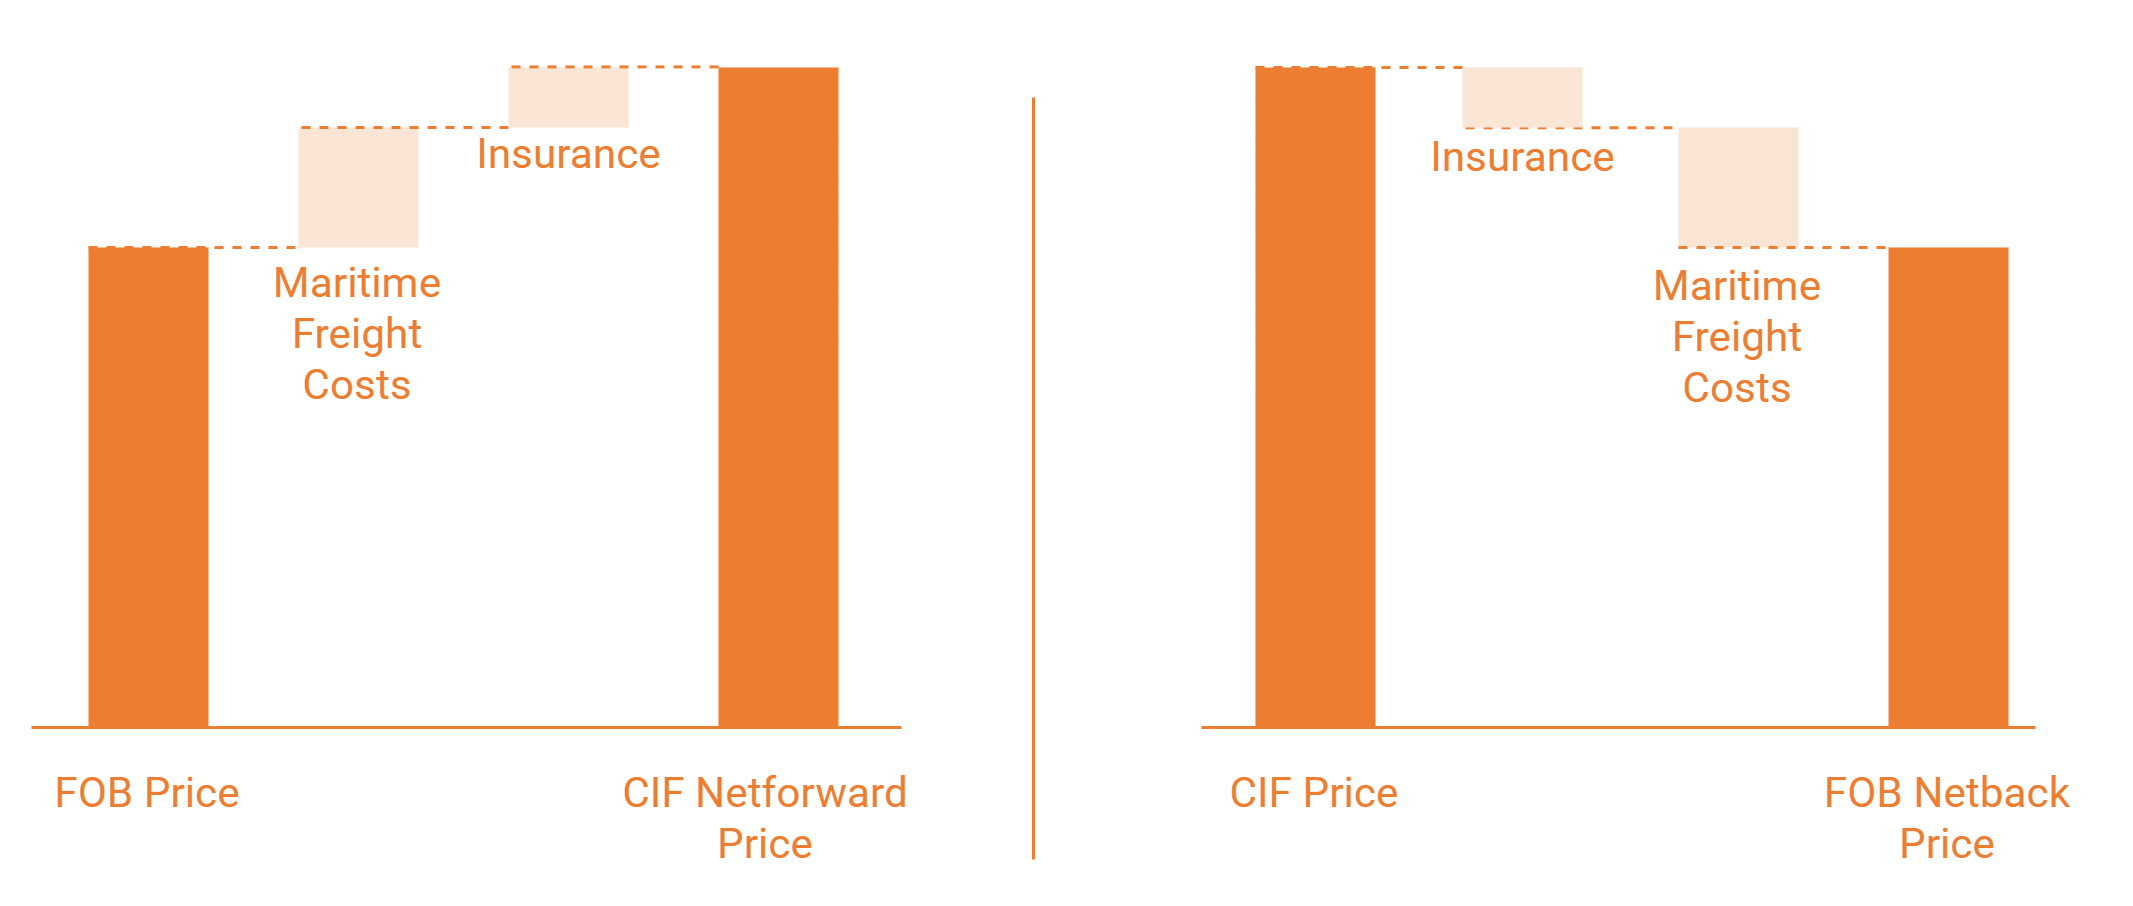
- Netforward — the value of the product arriving at the destination terminal, obtained by adding maritime freight and insurance to the origin price.
- Netback — the value of the product returned to the loading terminal, obtained by subtracting maritime freight and insurance from the destination price.
How do netback and netforward differ?
They move in opposite directions along the same freight leg:
- A netforward assessment starts from a price at the loading terminal (an FOB basis) and adds maritime freight and insurance to express the delivered cost at the destination terminal (a CIF basis).
- A netback assessment starts from a delivered price at the destination terminal (a CIF basis) and subtracts insurance and maritime freight to recover the value at the loading terminal (an FOB basis).
The result is reported in the currency and quantity unit of the assessment being produced, so a freight-based price is directly comparable with the other prices in its series.
Which freight rate is applied?
The freight rate reflects the transport form most commonly used for each assessment, even where other modes are sometimes used for shipping. Freight rates and insurance enter the calculation alongside the source assessment:
Price = function of other assessments, freight rates, and insurance.
The freight rates applied are assessed using the compiled and estimated approaches described in the Freight & Insurance article.
Preliminary Prices and Forecasts
What happens when data is insufficient?
When official data are unavailable, inadequate, or insufficient for a representative assessment—or when a data-driven approach is not suitable—analysts estimate values based on a wide range of factual market information. This estimation process follows a rigorous methodology: analysts meticulously collect and verify all market data used and propose mathematical models grounded in observed market behavior.
Information used in these estimates may include other published assessments, producer or export indices, labor costs, completed transactions, spread and exchange trades, fundamental supply-and-demand data, and other relevant factors. The resulting estimates are treated as preliminary data marked with "(P)" in publications, ensuring transparency about their methodological basis.
What are preliminary prices?
Preliminary prices are assessments derived from proprietary mathematical models developed to address delays in official statistics, which are typically released with lags of 1 to 2 months. The models provide the best available price estimates for periods up to the current month, ensuring timely market information without waiting for official data releases.
Because preliminary prices are model-derived rather than observed transactions, their accuracy is monitored and updated monthly. Accuracy metrics are published in methodology reports.
How are price forecasts produced?
In Energy Prices & Markets, short-term price forecasts for selected assessments are derived from mathematical models using a combination of forecast data: prices of related commodities, economic indices, and industry indicators. These models reflect the most probable scenario for the upcoming six months as of the date they are generated.
Forecasts are updated monthly because market parameters can shift significantly within short periods. Like preliminary prices, forecast accuracy is monitored and updated monthly, and the results are published in methodology reports.
Model Performance and Accuracy
How is model reliability measured?
The performance and accuracy of preliminary and forecast price models are continuously evaluated and made publicly available. To consolidate key evaluation metrics into a single reliability indicator, Intratec developed a proprietary metric: the Model Performance Score (MPS).
Three foundational metrics underpin all evaluations:
- Mean Absolute Percentage Error (MAPE): a percentage measuring the deviation between estimated and consolidated prices; contextualizes deviations in relative terms for comparison across periods and datasets.
- Mean Absolute Percentage Accuracy (MAPA): a percentage calculated as 100% − MAPE; measures the accuracy of estimated prices against consolidated ones.
- Directional Accuracy (DA): evaluates the model's ability to correctly predict price trends (rise or fall) — a practical reliability measure for decision-making.
Average MAPA and DA are calculated over three timeframes — the last 3 months, last 6 months, and last 12 months where consolidated prices are available — allowing direct comparison of estimates against actual consolidated prices over different periods.
What do MAPE, MAPA, and DA mean?
These three metrics capture complementary dimensions of model quality: magnitude of error, accuracy in percentage terms, and trend direction.
Mean Absolute Percentage Error (MAPE) quantifies the average deviation between estimated and consolidated prices as a percentage. A lower MAPE indicates smaller average errors. Because it is relative, MAPE supports comparison across different price levels, time periods, and datasets.
Mean Absolute Percentage Accuracy (MAPA) is the complement of MAPE, calculated as:
MAPA = 100% − MAPE
A MAPA of 95% means estimated prices were, on average, 5% away from consolidated prices. Higher is better.
Directional Accuracy (DA) measures how often the model correctly identifies whether prices moved up or down relative to the prior period. It is expressed as a percentage of correctly predicted directions. DA is particularly relevant for decision-making contexts where knowing the trend matters as much as knowing the precise level.
How is the Accuracy Index calculated?
The Accuracy Index (AI) is a single user-friendly indicator of a model's reliability for a given timeframe. It combines MAPA and DA into one weighted value:
Accuracy Index (AI) = (MAPA × (24 − num_obs) + DA × num_obs) / 24
where:
- 24 is the maximum total number of months used for evaluation.
- num_obs is the actual number of data points available for the timeframe being evaluated (for example, 3 for the last-3-months window or 12 for the last-12-months window).
The AI ranges from 0% to 100%; higher values indicate greater reliability. An AI is computed separately for each of the three evaluation timeframes (last 3 months, last 6 months, last 12 months).
When there is insufficient historical assessment data to estimate all parameters, the relevant metric is indicated as not available (NA) rather than reported with an unreliable value.
What is the Model Performance Score?
The Model Performance Score (MPS) combines the Accuracy Indexes from the three evaluation timeframes into one proprietary metric, assigning greater weight to more recent data. The weighting ratio is 5:3:2 for the last 3, 6, and 12 months respectively:
MPS = (0.5 × Last-3-Months AI + 0.3 × Last-6-Months AI + 0.2 × Last-12-Months AI) / 20
The MPS is expressed on a scale of zero to five circles. Five full circles (●●●●●) indicate an excellent model; three or fewer filled circles (e.g. ●●●●●) suggest areas for improvement.
The MPS measures the accuracy of both preliminary assessments and M1 (forward-month) forecasts, as those are most relevant for short-term planning. The forward-month horizon is the most critical.
The heavier weight on recent performance reflects that short-term model behavior is most indicative of current reliability.
How is forecast performance evaluated?
For M6 (six-month-ahead) forecasts, a high-level evaluation is presented by comparing model MAPA against a baseline Constant Price Model — also called the Naïve model. The comparison is expressed as a relative performance ratio:
Relative Performance Ratio = Intratec Model MAPA / Naïve Model MAPA
Values above 100% indicate that Intratec's model outperforms the Naïve benchmark. The Naïve model assumes prices remain constant — a simple reference point for gauging whether a forecast model adds predictive value beyond a no-change assumption.
This evaluation approach is applied to M6 forecasts specifically; the MPS (described above) covers preliminary assessments and M1 forecasts.