

What the Data Covers
Open the Full Methodology (PDF)
See a Full Commodity Sample (Diammonium Phosphate)
What is Primary Commodity Prices?
Summary
An annual subscription program that delivers monthly, independent price assessments for commodities worldwide, built from official trade data and computational models rather than subjective market quotes, and organized by industry.
Primary Commodity Prices is an annual subscription program that delivers monthly, independent price assessments for commodities worldwide. A new set of assessments is released each month, following the published release schedule, so the reported values reflect the latest available data. It serves traders, procurement and cost teams, and analysts who need reliable, independent price benchmarks.
Three principles govern the program's design:
- Objective measurement: assessments rest on verifiable, quantitative data — primarily international trade deals reported by official statistics — rather than subjective buyer and seller quotes that reflect expectations rather than actual transactions. This keeps the data transparent, auditable, and unbiased.
- Standardized assessment: the same methodology is applied across every commodity and every month, so month-to-month comparisons remain valid.
- Actionable synthesis: monthly price assessments and short-term forecasts are organized into a consistent structure that turns raw data into decision-ready insight.
The methods behind each price value — trade-based, formula-based, freight-based, manufacturing cost-based, and compiled — are detailed on the Price Assessments page, and the monthly release cadence on the Data Timing page.
Which industries and commodities does Primary Commodity Prices cover?
Summary
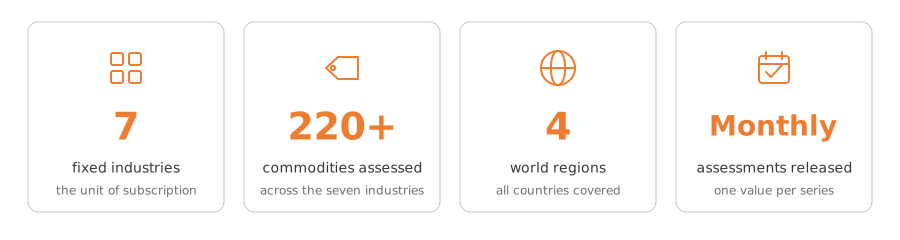
Coverage spans seven industries and 220+ commodities, framed as industries → commodities → locations. The per-industry commodity lists live in Industries and Commodities Covered; the exhaustive per-assessment list lives in the assessment catalog.
Coverage is framed from the industry down: industries → commodities → locations. Seven fixed industries organize the full scope — Fertilizers & Gases, Olefins & Derivatives, Aromatics & Derivatives, Alcohols & Organic Acids, Polymers, Inorganic Chemicals, and Metals & Mining — and across them 220+ commodities are assessed. For each commodity, the assessments recognized as most relevant for international trade are presented, spanning multiple countries and world regions.
The commodities assessed within each industry are listed in Industries and Commodities Covered, while the exhaustive, per-assessment coverage — every commodity and every location assessed within each industry — is maintained in the assessment catalog, which is the authoritative reference for what is covered and is kept current there rather than reproduced here.
How is coverage organized?
Summary
A subscription is purchased by industry, not by country. Subscribing to an industry grants access to every commodity assessment within it across all covered countries and world regions.
Coverage is organized by industry, not by country. A subscription is purchased by industry: subscribing to an industry grants access to every commodity assessment within it, across all the countries and world regions covered for those commodities. For each commodity, a new price value is released monthly for each available series.
A subscription to Polymers grants access to the assessments for every polymer commodity in that industry — including HDPE, LDPE, LLDPE, and Polystyrene — across all the countries and world regions where each is assessed.
Geographically, coverage is organized around the four Intratec world regions — Americas, Europe, Asia, and Africa & Middle East — which are defined in the World Regions article. Unlike solutions built around a fixed country set, coverage here is not limited to a defined universe of countries: it extends to all countries covered for the commodities within each subscribed industry.
How does Primary Commodity Prices differ from other solutions?
Each Intratec solution answers a different question about industrial markets:
- Primary Commodity Prices — what a commodity is worth in a given market: independent monthly price assessments for 220+ commodities worldwide, by industry.
- Energy Prices & Markets — energy commodity prices with market trends, trade flows, and self-sufficiency analyses for a defined country set.
- Industry Economics & Competitiveness — monthly rankings of country manufacturing competitiveness across seven industrial sectors.
- Commodity Production Costs — what it costs to produce a commodity: capital and operating cost analyses of industrial plants.
The solutions also feed one another — manufacturing cost-based assessments, for example, draw their input prices from the commodity, energy, and industry-economics portfolios (see Where do the input prices come from?).
How is the analysis validated?
Every published figure passes through the same two-layer validation used across all Intratec solutions — automated checks on the full dataset, then human expert review of a representative, risk-guided sample — applied as the final stage before release. The full process, including how anomalies are flagged and how accuracy is tracked over time, is described in the Validation & Accuracy section.