

World Regions Covered
How does Intratec organize the world into regions?
Intratec applies a single, consistent geographic hierarchy across all assessments. The world is divided into four top regions, each region splits into sub-regions, and each sub-region groups the countries it contains. This three-level structure — region, sub-region, country — keeps every analysis comparable and lets findings roll up cleanly from local detail to a global view. The same four-region hierarchy underlies the fixed 33-country benchmarking universes used by Industry Economics & Competitiveness and Energy Prices & Markets, so each individually analyzed country's results can also be read at the sub-region and region level. Primary Commodity Prices applies the same regional hierarchy but organizes its coverage by industry rather than by a fixed country set, so its commodity price assessments span the countries Intratec covers within each industry.
What are the main regions and sub-regions?
The four top regions are Americas (AME), Europe (EUR), Asia (ASI), and Africa & Middle East (AMD). Each divides into sub-regions, and each sub-region groups the individual countries assigned to it, as shown below.
| Region | Sub-region | Countries |
|---|---|---|
| Americas (AME) | North America (NAM) | United States, Canada, Mexico |
| South America (SAM) | Argentina, Bolivia, Brazil, Chile, Colombia, Ecuador, Guyana, Paraguay, Peru, Suriname, Uruguay, Venezuela | |
| Central America (CAM) | Costa Rica, Cuba, Dominican Republic, El Salvador, Grenada, Guatemala, Haiti, Honduras, Jamaica, Nicaragua, Panama, Trinidad and Tobago | |
| Europe (EUR) | Northwest Europe (NWE) | Belgium, Denmark, Finland, France, Germany, Iceland, Ireland, Luxembourg, Netherlands, Norway, Sweden, Switzerland, United Kingdom |
| Central Europe (CEU) | Albania, Austria, Croatia, Czech Republic, Hungary, Poland, Serbia, Slovakia | |
| South Europe (SEU) | Greece, Italy, Malta, Portugal, Spain | |
| East Europe (EEU) | Armenia, Belarus, Bulgaria, Estonia, Lithuania, Romania, Ukraine | |
| Asia (ASI) | Northeast Asia (NEA) | China, Georgia, Hong Kong, Japan, Macao, Mongolia, Russia, South Korea, Taiwan |
| Southeast Asia (SEA) | Australia, Bangladesh, Cambodia, India, Indonesia, Malaysia, Myanmar, New Zealand, Pakistan, Philippines, Singapore, Thailand, Vietnam | |
| Central Asia (CEA) | Kazakhstan, Kyrgyzstan, Turkmenistan, Uzbekistan | |
| Africa & Middle East (AMD) | Middle East (MDE) | Bahrain, Iran, Iraq, Israel, Jordan, Kuwait, Oman, Qatar, Saudi Arabia, Syrian Arab Republic, Turkey, United Arab Emirates |
| Africa (AFR) | Algeria, Angola, Côte d'Ivoire, Egypt, Ghana, Guinea, Kenya, Libya, Morocco, Nigeria, South Africa, Tunisia |
This is the complete set of countries tracked within the geographic framework; not every country listed is analyzed as its own entity within its sub-region — see
What distinguishes individual from aggregate country coverage?
A country analyzed individually receives its own figures and profile: it appears as a distinct entity with dedicated data and results. A country covered in aggregate has no standalone treatment — its contribution is rolled up into the totals of its sub-region or region and reported only at that level. In Intratec's source region map, individually analyzed countries are shaded by their Intratec world region; all other countries are shown in gray as aggregate-only.
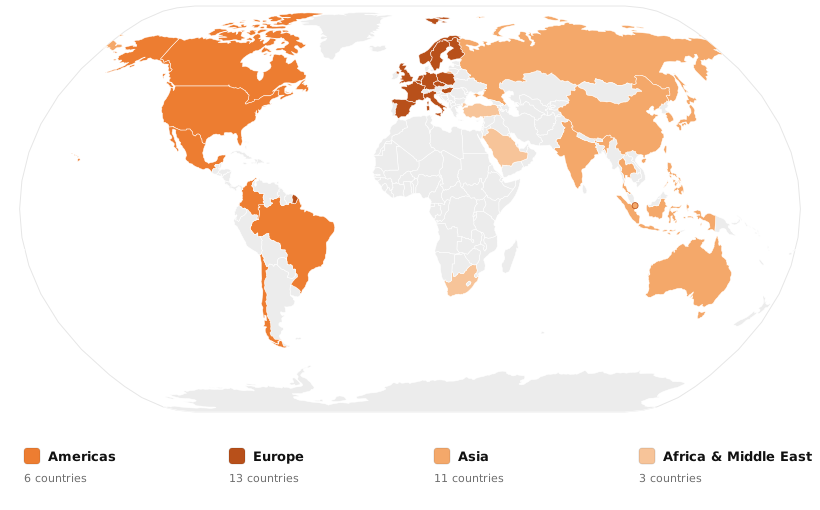
Why analyze some countries only in aggregate?
Individual analysis is reserved for countries where data availability and market size justify the detail. Where reliable data is limited or a market is too small to warrant separate treatment, the country is folded into its regional aggregate instead. This keeps the framework rigorous and consistent while still accounting for every country's contribution to the broader regional picture. In practice, this is why Industry Economics & Competitiveness and Energy Prices & Markets each hold to a fixed set of 33 individually analyzed countries — chosen because, together, they already account for the large majority of global manufacturing output and energy demand respectively, leaving smaller markets to their regional aggregates.