

Analysis Methodology
How is a production cost report developed?
Summary
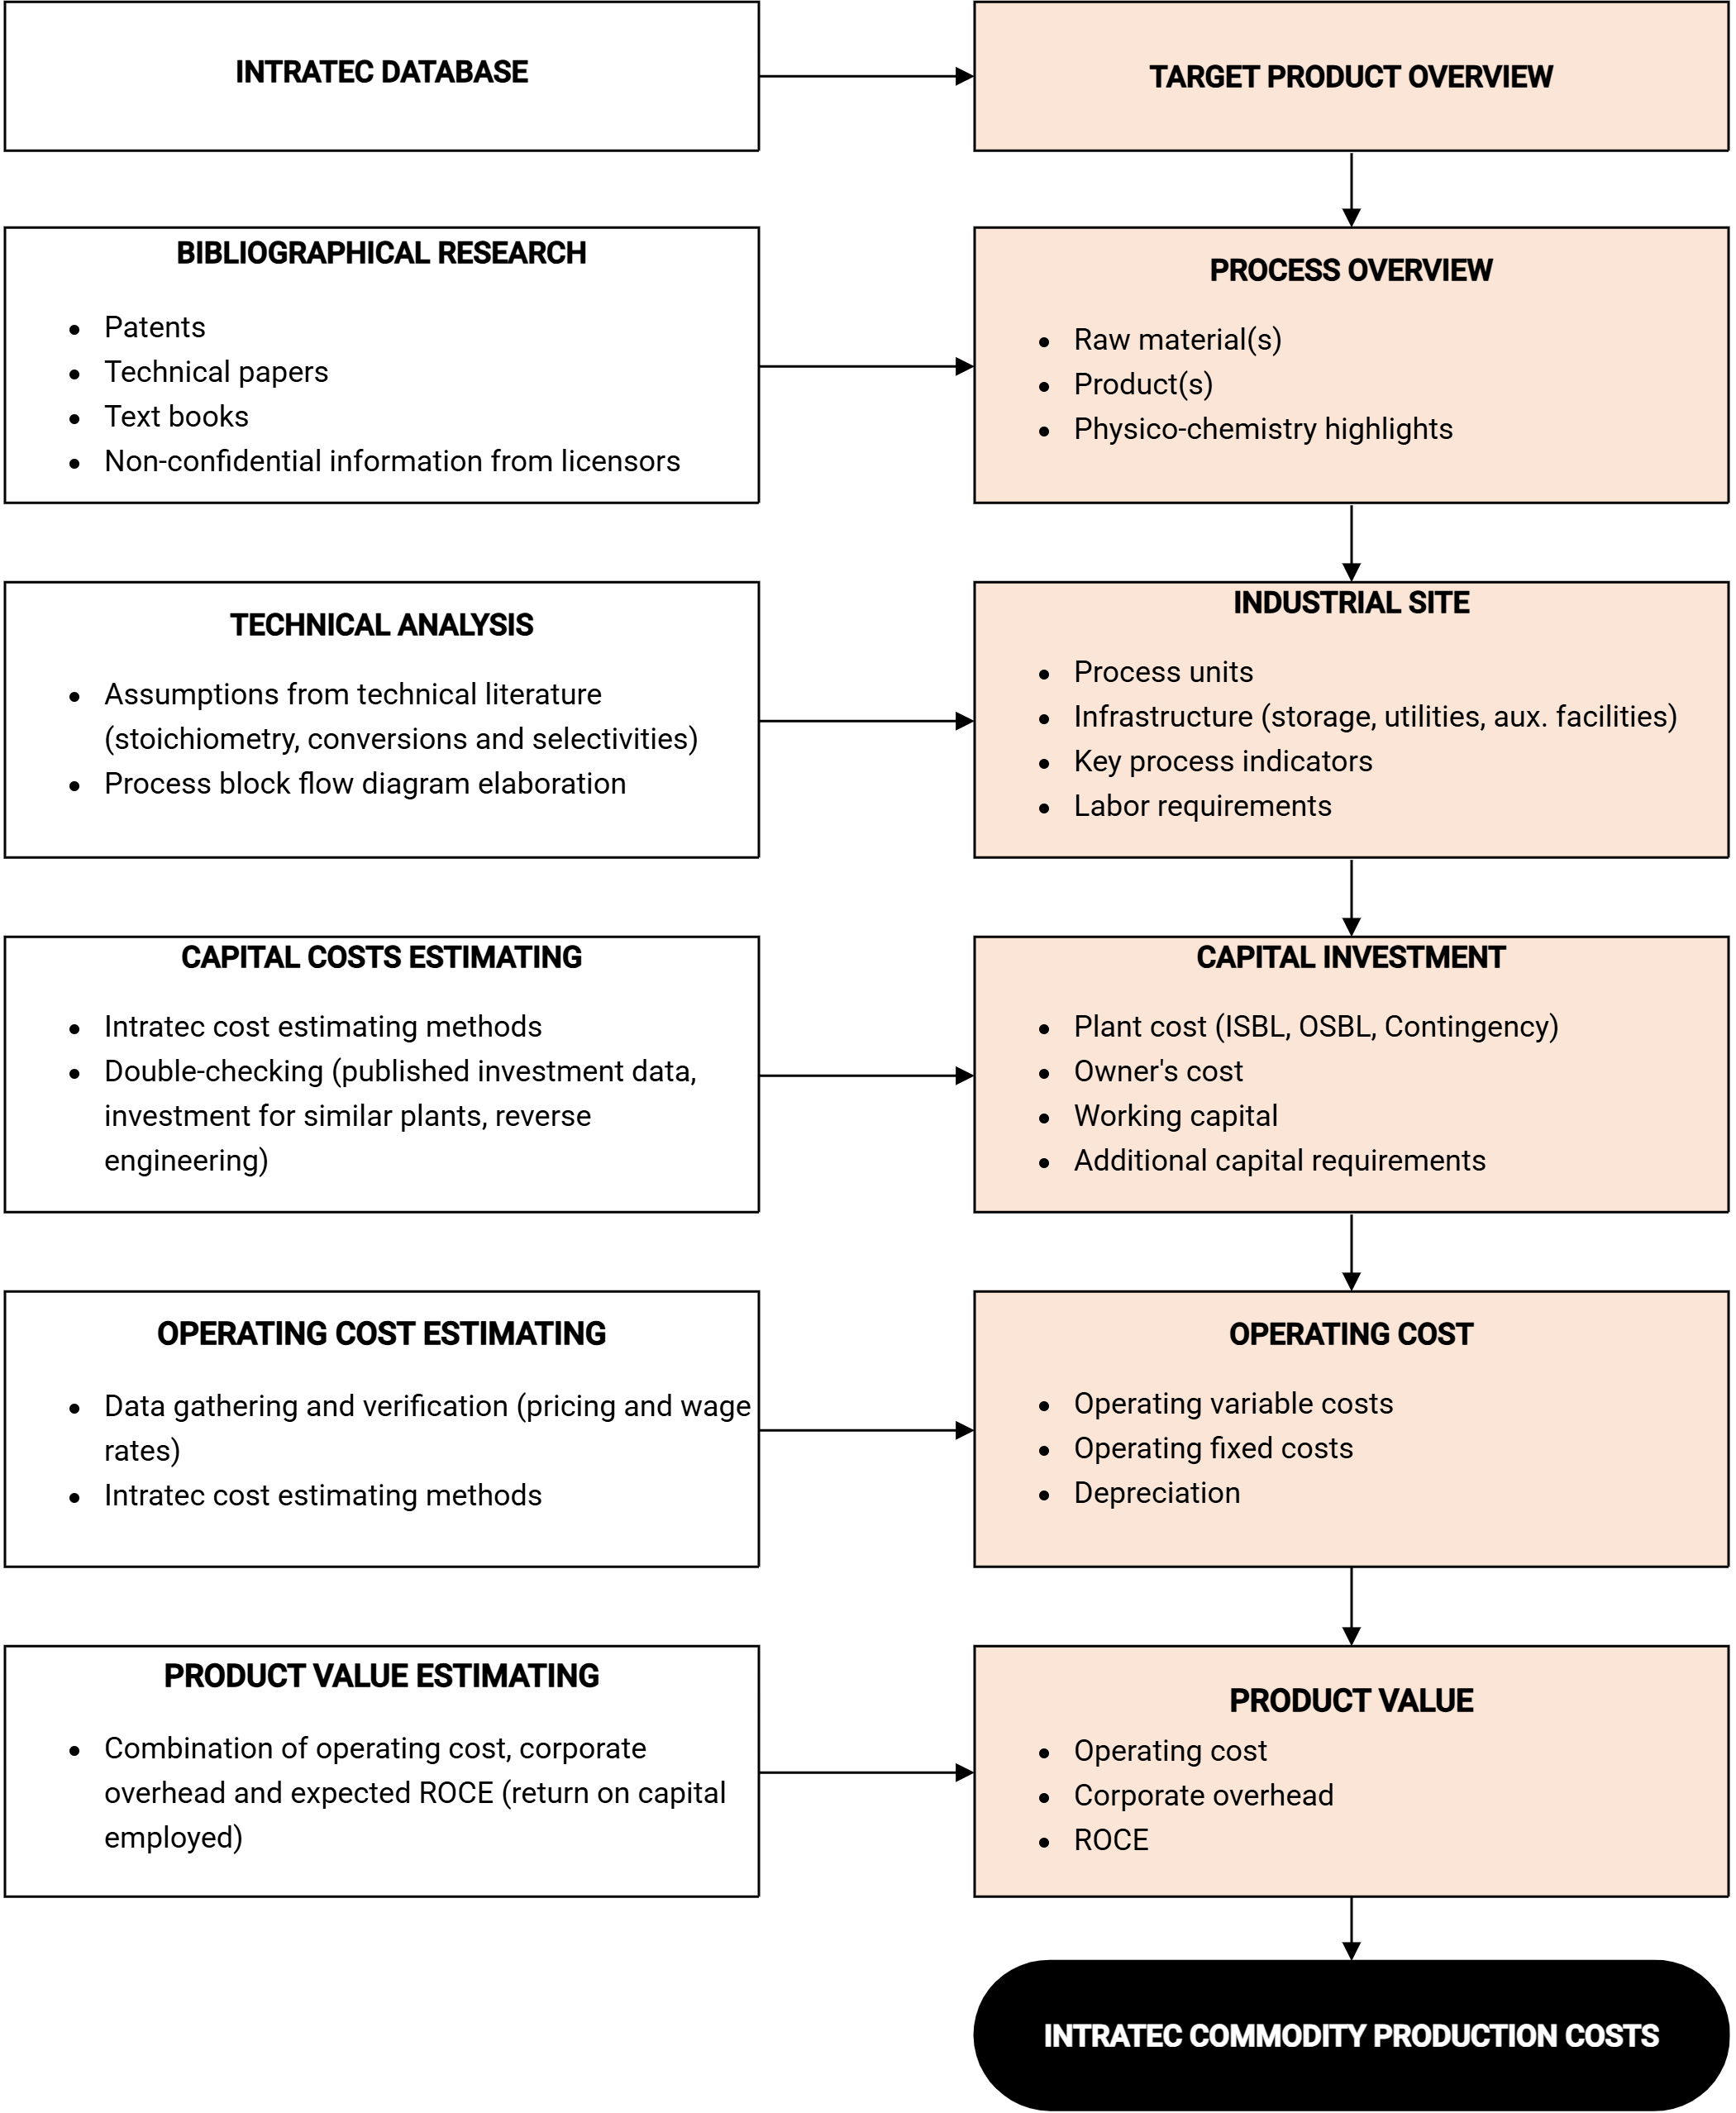
Every report is built by the same seven-step workflow — regardless of commodity, production route, or country: research the process from public literature, reconstruct it as a conceptual design, then estimate capital investment, operating costs, and product value.
A Commodity Production Costs report is developed through a fixed sequence of steps, applied identically to every commodity, production route, and country:
- Bibliographical research — the production process is studied from public technical literature: patents, encyclopedias, textbooks, technical papers, and non-confidential licensor information, reviewed by the Intratec team.
- Process overview — the chemistry is characterized: main reactions and stoichiometry, conversions, yields and selectivity, side reactions, catalysts, the quality required of each raw material, and the uses and specifications of the product.
- Technical analysis — the process is reconstructed as a conceptual design, divided into
ISBL andOSBL areas and captured in a block flow diagram. - Industrial site examination — process units, site infrastructure, key process indicators, and labor requirements are defined from that design.
- Capital investment estimating — the funds required to build the plant and make it operational.
- Operating cost estimating — the recurring cost of running it.
- Product value estimating — the price the product must sustain to cover all costs plus a return on the capital invested.
The first four steps build the conceptual process design; the last three turn it into the cost cascade consolidated in the one-page Production Cost Datasheet. The three estimating steps are detailed in the capital investment, operating cost, and product value articles.
Where does the underlying data come from?
Summary
The figures come from public sources — national government statistics bureaus, foreign trade agencies, international organizations, and futures exchanges — covering the commodity prices, utility costs, and wage rates of the country and quarter analyzed.
The data behind every report is drawn almost entirely from public sources, not from confidential or proprietary information. The main categories are:
- National government statistics bureaus and foreign trade agencies — official transaction prices and wage rates.
- International organizations.
- Futures markets exchanges.
These sources supply the commodity prices, utility costs, and labor costs for the specific country and quarter each report examines. The prices and wage rates used are average transaction values for that region and period; how they enter the cost calculation is described in the operating cost article.
What technical literature supports the analysis?
The methodology draws on an established body of cost-engineering and process-economics literature — textbooks, handbooks, and technical papers on capital-cost estimation, process economics, and chemical-plant design. These works underpin the cost models and estimating methods applied throughout the analysis. The complete list is published on the References page.
Process and Site Analysis
How is the production process analyzed?
Summary
The process is first characterized chemically — its reactions, conversions, yields, and catalysts — then reconstructed as a conceptual design split into core and support areas and mapped in a block flow diagram.
Analysis of the production process happens in two stages. First, a process overview establishes the chemistry: the main reactions and stoichiometry, conversions, yields and selectivity, side reactions, and catalysts, together with the quality required of each raw material and the uses and specifications of the product.
A technical analysis then turns that understanding into a conceptual process design. The process is divided into
What are ISBL and OSBL?
ISBL and OSBL are the two areas a plant is divided into for cost estimation:
- ISBL (Inside Battery Limits): the core process area — the equipment that directly transforms raw materials into the product, such as reactors and separation and purification units.
- OSBL (Outside Battery Limits): the supporting infrastructure a plant needs but that does not directly make the product — utility supply, storage, and auxiliary and administrative facilities.
Each area is estimated separately and both carry capital cost. Splitting the plant this way keeps the estimate organized and lets the same cost structure be compared across different processes.
How is a plant broken down for cost estimation?
Summary
A plant is broken into functional units — each a significant processing step — and its capital cost is built up unit by unit.
For cost estimation, a plant is divided into functional units. A functional unit is a significant step in the process where a particular physico-chemical operation takes place — a distillation, a reaction, an evaporation — grouping the main equipment and its ancillaries rather than a single machine.
Each functional unit is characterized by cost-relevant attributes, such as its highest operating temperature and pressure and a representative material of construction. Capital cost is then estimated unit by unit and summed, so the plant's cost is built from the bottom up out of its constituent operations. The type and number of functional units also drive downstream figures, including labor requirements.
What infrastructure is assumed for the plant?
Summary
The plant is assumed to include OSBL infrastructure — utilities, storage, and auxiliary and administrative buildings — sized to the level of integration most typical for the process and location.
The plant is assumed to include the OSBL infrastructure: the installations required for operation but not directly involved in manufacturing. These cover utility supply and generation, storage for raw materials and products, and auxiliary and administrative buildings.
How much infrastructure a plant needs depends on how integrated it is with neighboring facilities — whether it draws utilities and feedstocks from adjacent sites or provides its own. Each analysis assumes the level of integration that is most typical for the process and location, which primarily determines the storage capacity the plant must include.
How is plant capacity chosen for each analysis?
Each report analyzes a plant at a single nominal capacity, chosen so the plant would be competitive on a global scale — a representative, world-scale size for the process rather than the capacity of any one existing plant. This keeps reports comparable, because every analysis reflects an efficient, modern plant.
For processes where scale strongly affects economics, the Premium edition's Plant Capacity Assessment recalculates capital costs, operating costs, and product value across alternative capacities.
How are labor requirements estimated?
Summary
Labor is estimated from the plant's functional units, in two categories — operating labor and supervision labor — priced at the wage rates of the country and period.
Labor requirements are estimated from the plant's functional units: the type and number of process operations determine how many people are needed to run the plant. Two categories are counted:
- Operating labor — the operators required per shift to run the process.
- Supervision labor — the supervisors overseeing those operators per shift.
These head-counts, combined with the wage rates for the country and period, give the plant's labor cost. Some roles are deliberately excluded from this estimate — outsourced labor, technical assistance, plant engineers, and general services such as purchasing, employee relations, and catering — because they fall outside the standardized operating-labor basis.
Technology Maturity
How is a technology's maturity assessed?
Summary
A process technology's maturity is classified on a five-level scale, from Conceptual up to Established, adapted from the Technology Readiness Level method; the result is the report's Technology Maturity Assessment.
Each production route is classified by how proven its technology is, using a five-level scale adapted from the Technology Readiness Level (TRL) method. The classification — the report's Technology Maturity Assessment — runs from the most proven technologies to those still at the concept stage:
The maturity level is not a descriptive label alone — it sets several assumptions in the cost model, as described in
How does technology maturity affect the estimates?
Summary
Maturity is the hinge of the cost model: the less proven a technology, the larger the contingencies and uncertainty applied — and the higher the return expected on the capital invested.
Where a technology sits on the
- Process contingency — a buffer for missing or uncertain technical information, added to plant cost; larger for less mature technologies.
- Project contingency — an allowance for how much a project may still evolve; also larger for less mature technologies.
- Start-up inefficiency and research & development costs — greater for newer technologies, reflecting a rougher start-up and continuing development effort.
- Expected return on capital employed (ROCE) — higher for less mature technologies, reflecting greater technical risk.
- Estimate accuracy — the accuracy range widens as maturity falls and less information is available.
The exact percentage tables for each of these factors are given in the capital investment, product value, and accuracy and limitations articles.