

Operating Costs
What does the operating cost estimate include?
Summary
The operating cost is the recurring annual cost of running the plant, built from three parts — operating variable costs, operating fixed costs, and depreciation.
The operating cost in a Commodity Production Costs report is the recurring annual cost of running the plant at its operating rate. It is estimated as the sum of three components:
The operating variable costs are themselves the sum of net raw material costs and net utility costs. The net raw material cost is the cost of the raw materials consumed, less the credits earned from any saleable by-products: the raw material cost is the sum, across every feed, of its price multiplied by the amount consumed per unit of product, and the by-product credits are then subtracted.
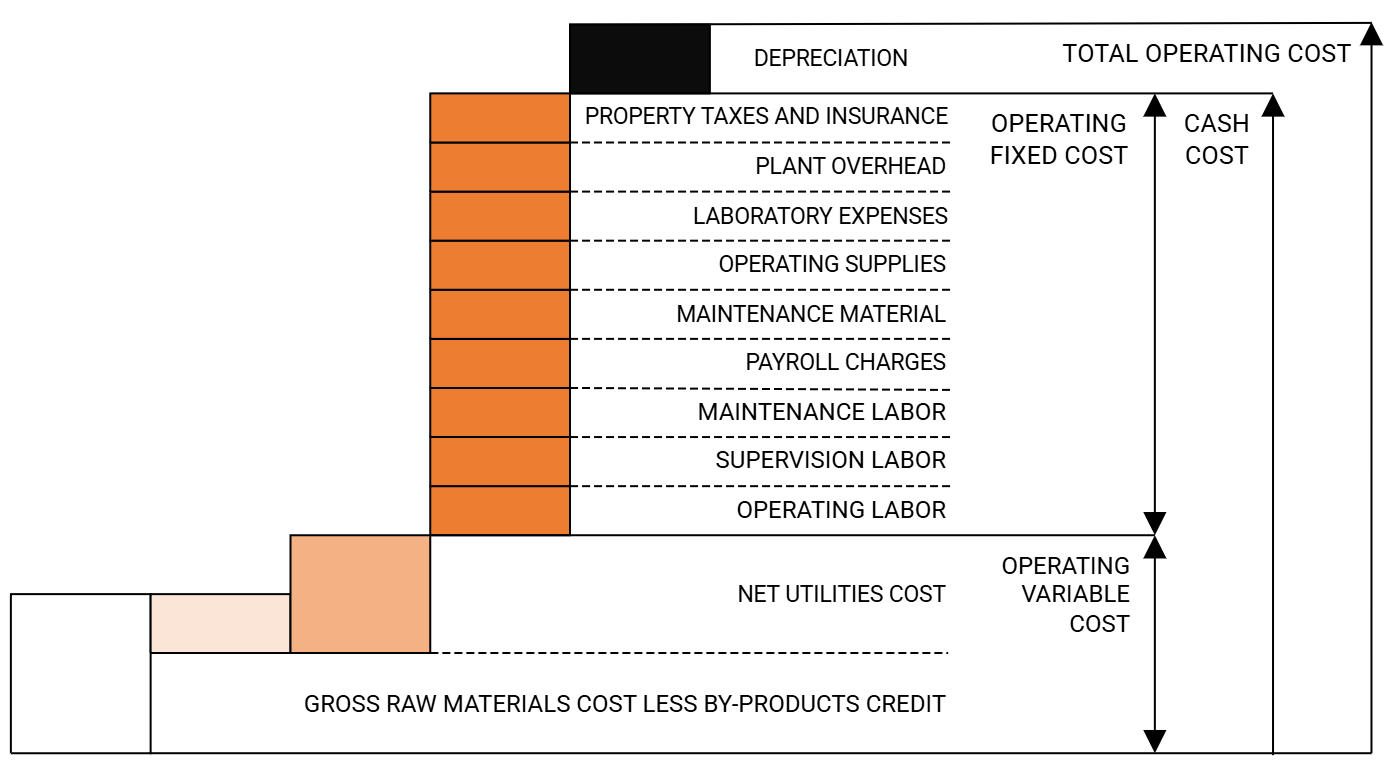
The operating fixed costs and depreciation are set out in
What is the difference between cash cost and total cost?
Summary
The operating cash cost is the recurring out-of-pocket cost of running the plant — variable plus fixed costs. The total operating cost adds depreciation on top.
Both figures appear in a report's cost cascade, one built on the other. The operating cash cost is the recurring out-of-pocket cost of operating the plant: operating variable costs plus operating fixed costs. It excludes depreciation, because depreciation is not an actual cash outlay.
The total operating cost adds depreciation to the cash cost, giving the full cost of operation once the gradual recovery of the plant's capital is included.
In the Production Cost Datasheet, the cascade runs from the variable costs up to the cash cost, then to the total operating cost, before corporate overhead and a return on capital are added to reach the product value.
Prices and Wages
Where do raw material and utility prices come from?
Summary
Prices are average transaction values drawn from trade statistics issued by official government agencies, for the country and period each report covers. Commodities with no trade statistics are valued at a transfer price instead.
The raw material and utility prices behind a report are average transaction prices for the country and time period being analyzed, taken from trade statistics issued by official government agencies. Because they are average transaction values, differences in product qualities, discounts related to volumes, and contractual negotiations are not considered.
Some commodities have no trade statistics — for example, intermediate chemicals that are not traded because of transportation constraints and are instead generated and consumed on site. In those cases the analysis assigns a transfer price: all the costs of manufacturing that product, plus an amount to pay for the investment made to manufacture it.
These prices feed the
How are wages for plant labor determined?
The wage rates for plant labor — for both operators and supervisors — are taken from data published by official government agencies, for the country and period each report analyzes. These wage rates are combined with the per-shift head-counts of operating and supervision labor to give the plant's labor cost; how those head-counts are set is covered in How are labor requirements estimated?.
How are utility consumptions and costs estimated?
Summary
A plant's use of steam, electricity, fuel, and refrigeration is estimated from correlations developed by the Intratec team, driven by parameters of the block flow diagram; each consumption is then multiplied by the utility price.
The utilities a plant consumes — steam, electricity, fuel, and refrigeration — are estimated through correlations internally developed by the Intratec team, refined from a well-established method in the technical literature. The correlations let consumption be estimated from basic information about the process, rather than from a detailed energy balance.
They are driven by parameters read from the block flow diagram, together with the chemical properties of the components involved, including:
- the number of functional units, and the type of each according to its energy consumption — for instance whether it involves phase changes, or endothermic or exothermic reactions;
- flow rates;
- the heats of reaction involved in the process;
- the molecular weights and approximate boiling points of the components.
Each estimated consumption is then multiplied by the corresponding utility price to give the utility cost. Per-utility consumption detail is presented in the Detailed and Premium editions.
Fixed Costs and Depreciation
What items make up the operating fixed costs?
Summary
Operating fixed costs are the costs of running the plant that do not move directly with output. They comprise eight items — operating and supervision labor, maintenance, payroll charges, operating supplies, laboratory expenses, plant overhead, and property taxes and insurance.
The operating fixed costs are the recurring costs of keeping the plant staffed and maintained, which do not vary directly with the operating rate. They are estimated as eight items, each tied to a defined basis:
The per-shift head-counts for operating and supervision labor come from the plant's functional units, as described in How are labor requirements estimated?; the wage rates applied to them are covered in
How is maintenance cost estimated?
Summary
Maintenance is estimated as a percentage of plant cost per year — in the United States, typically 1–4%, split into labor and materials. The exact factor depends on the fluids the plant handles and its industry sector.
Maintenance cost covers the labor and materials needed to keep the plant's equipment in working order. It is estimated as a percentage of the plant cost per year. For plants in the United States, maintenance typically ranges from 1% to 4% of plant cost per year, usually split into 30–50% labor and 50–70% materials.
The exact percentage depends on the type of equipment a plant uses — closely tied to the kind of fluid it handles — and on its industry sector. The table below gives the maintenance factor, as a percentage of plant cost per year, by fluids handled (rows) and industry sector (columns):
How is depreciation calculated?
Summary
Depreciation is calculated by the straight-line method — over a 10-year life for the process units and owner's-cost assets, and a 20-year life for the site infrastructure. It is treated as an operating expense for accounting, though it is not a true cash cost.
Depreciation spreads the plant's depreciable capital across its service life. It is calculated by the straight-line method, which allocates an equal amount each year. Two service lives are assumed:
- 10 years for the ISBL process units and for the assets derived from the owner's cost — a 10% annual charge;
- 20 years for the OSBL site infrastructure — a 5% annual charge.
Process and project contingencies are included in the depreciable base, so annual depreciation is:
Depreciation = 10% × (ISBL investment + process contingency + ISBL project contingency) + 5% × (OSBL investment + OSBL project contingency) + 10% × owner's cost
The contingencies and capital components in this formula are defined in the capital investment article. Although depreciation is added to the operating cash cost to reach the total operating cost, it is not an actual cash outlay — it is treated as an operating expense for accounting purposes, allowing the cost of the plant to be recovered over time.